Charting Tweets with Kibana 4 and CloudWatch
03 Aug 2015A lot of people have a lot of data in their Elasticsearch clusters. We have all the geotagged tweets coming out of cities for the past few months. Extracting any additional insight is a big win, and this is where Kibana comes in.
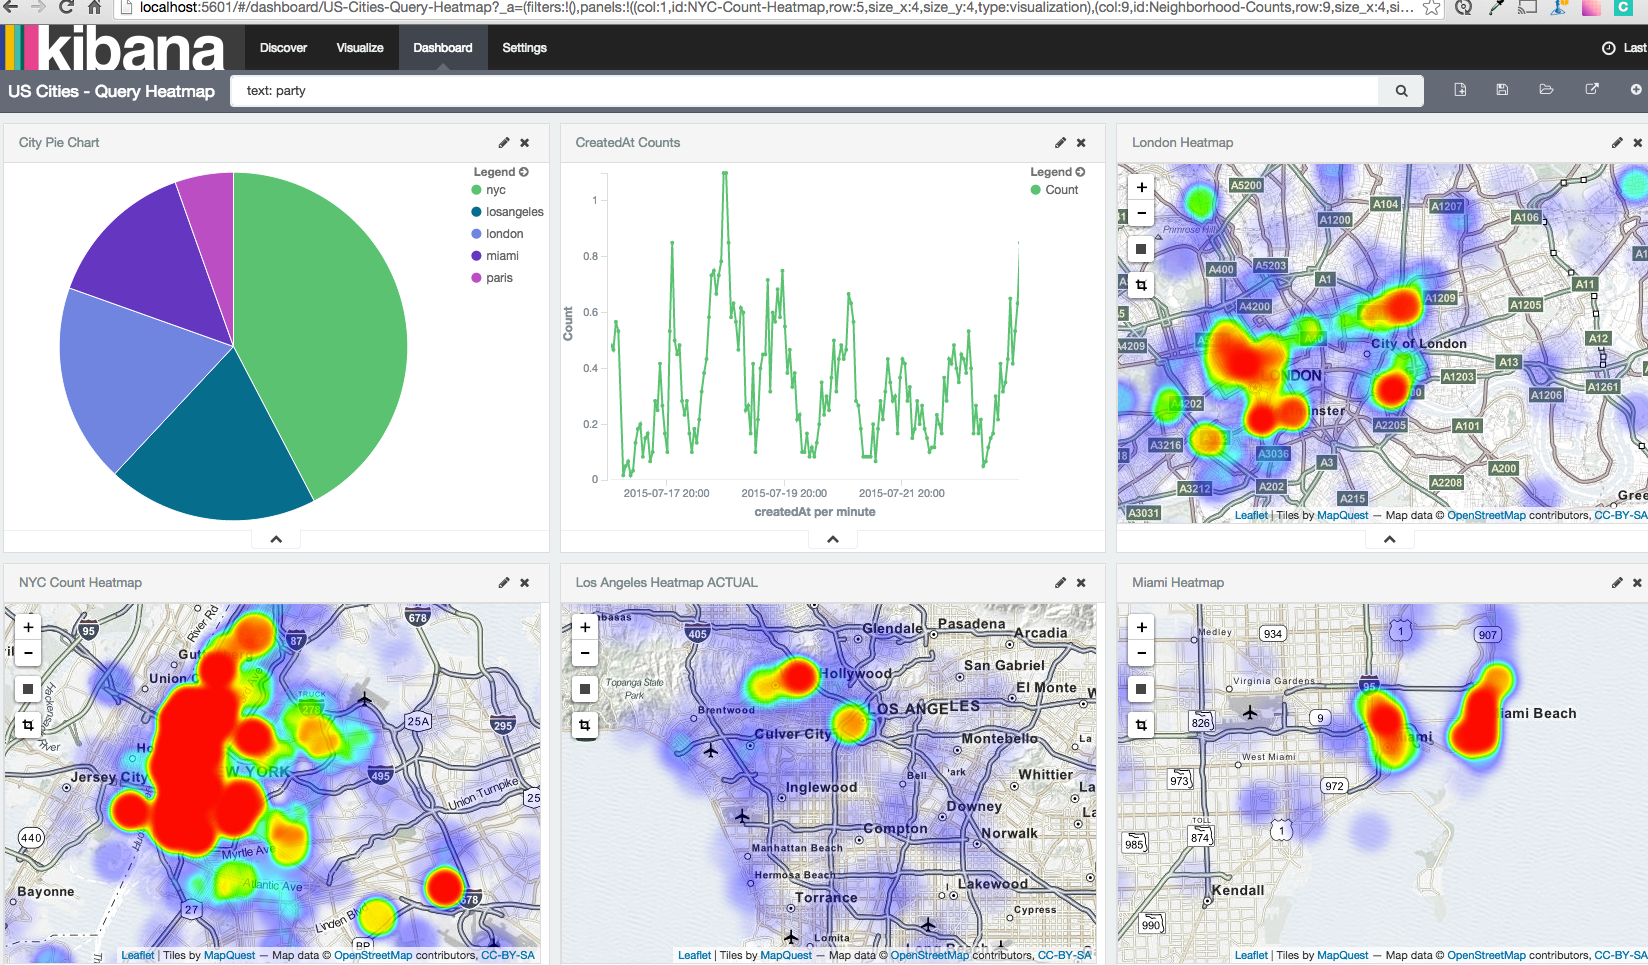
My city tweets are pretty noisy at the moment. I’ll check back in when I’ve sliced out something meaningful.
In the mean-time, I’ve been tracking the tweet frequency of certain cities via Amazon’s CloudWatch. Mostly so SNS can send me a text when things go quiet, but it makes for a decent time-series chart:
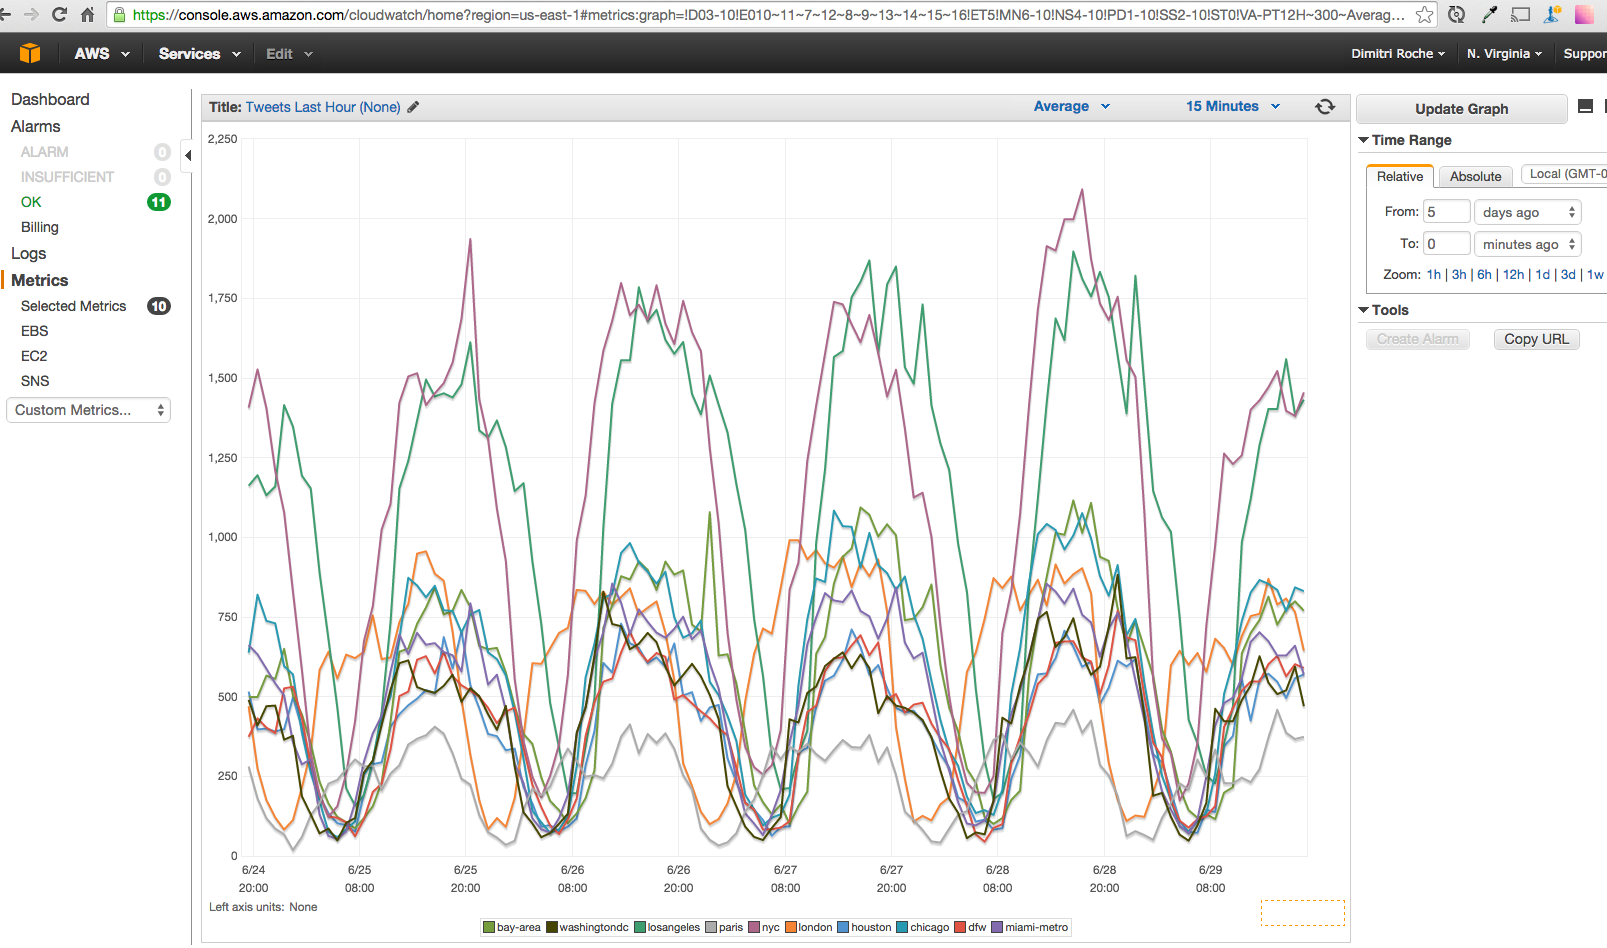
Three takeaways here:
- The day night cycles present an obvious pattern, although it never truly goes quiet.
- NYC and LA have a dramatically higher volume than the other cities, which makes sense given their size.
- Parisians have better things to do than tweet.